
1 dataset, 10 visualisations with R
Creating 10 datavisualisations from 1 dataset with R.
Back from La fabrique de l’info

On the 12th of march, I gave a speech in Rennes about data & visualisation.
During this talk, I presented the audience with a series of dataviz made from one dataset, in order to show how you can get various information and points of view from the very same dataset, depending on what you want to show the reader.
For this, I took this dataset, and created 10 visualizations, each focusing on specific variable(s). Here’s how to make them with R.
1 dataset, 10 dataviz
Notes These plots have been created using tools from the databzhtools you can find here : https://github.com/DataBzh/Data-bzh-tools
Download it on your hard drive, and load it in R with : source("data-bzh-tools-master/main.R")
#Charger les données
library(tidyverse)
source(file = "data-bzh-tools-master/main.R")
prim <- read_csv2("https://data.enseignementsup-recherche.gouv.fr/explore/dataset/fr-esr-pes-pedr-beneficiaires/download/?format=csv&timezone=Europe/Berlin&use_labels_for_header=true")
prim$Année <- paste0("01-01-",prim$Année) %>%
lubridate::dmy()
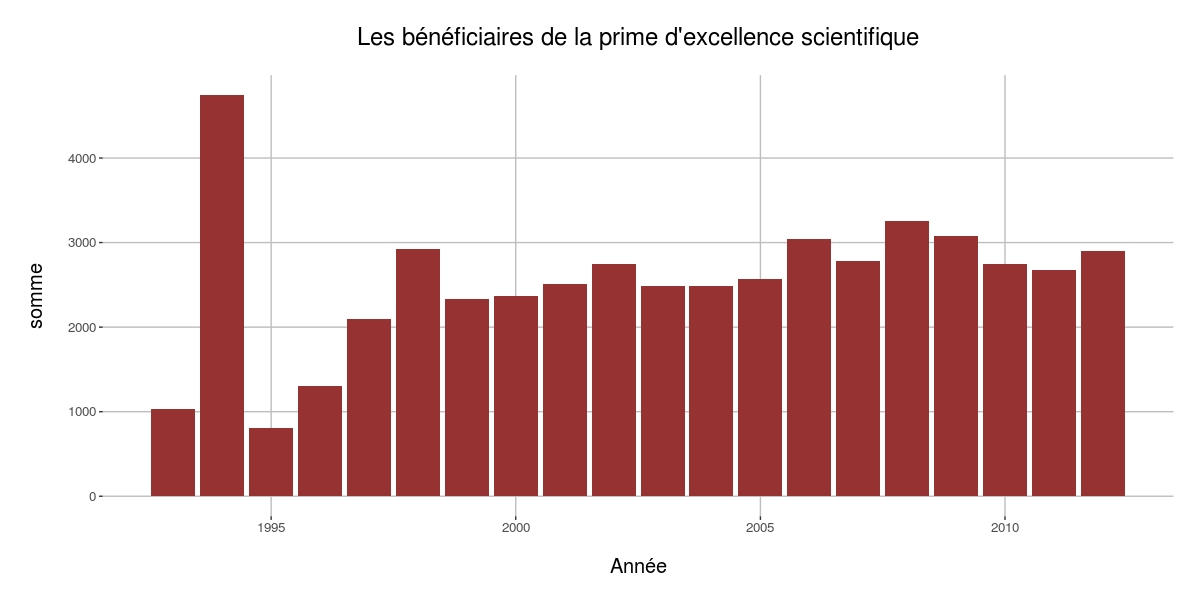
Frequency distribution
prim %>%
  group_by(Année) %>%
  summarise(somme = sum(Bénéficiaires))%>%
  ggplot(aes(Année, somme)) +
  geom_bar(stat = "identity", fill = databzh$colour1) +
  labs(title = "Les bénéficiaires de la prime d'excellence scientifique") +
  databzhTheme()
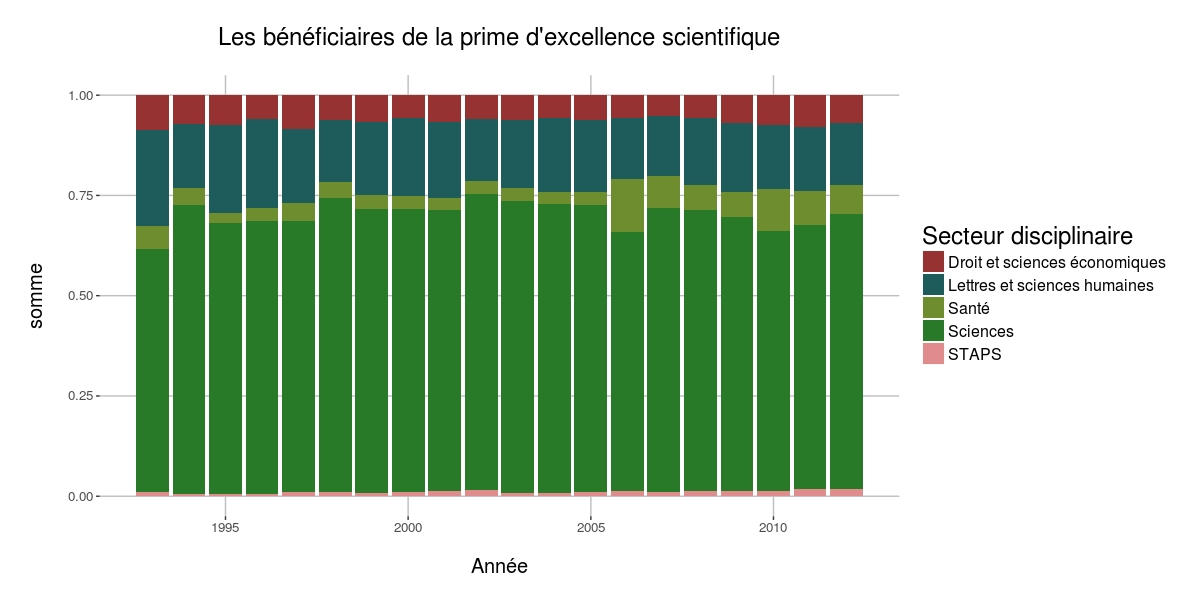
Prop by sector
prim %>%
  group_by(Année, `Secteur disciplinaire`) %>%
  summarise(somme = sum(Bénéficiaires))%>%
  ggplot(aes(Année, somme, fill = `Secteur disciplinaire`)) +
  scale_fill_manual(values = databzh$colours) +
  geom_bar(stat = "identity", position = "fill") +
  labs(title = "Les bénéficiaires de la prime d'excellence scientifique") +
  databzhTheme()
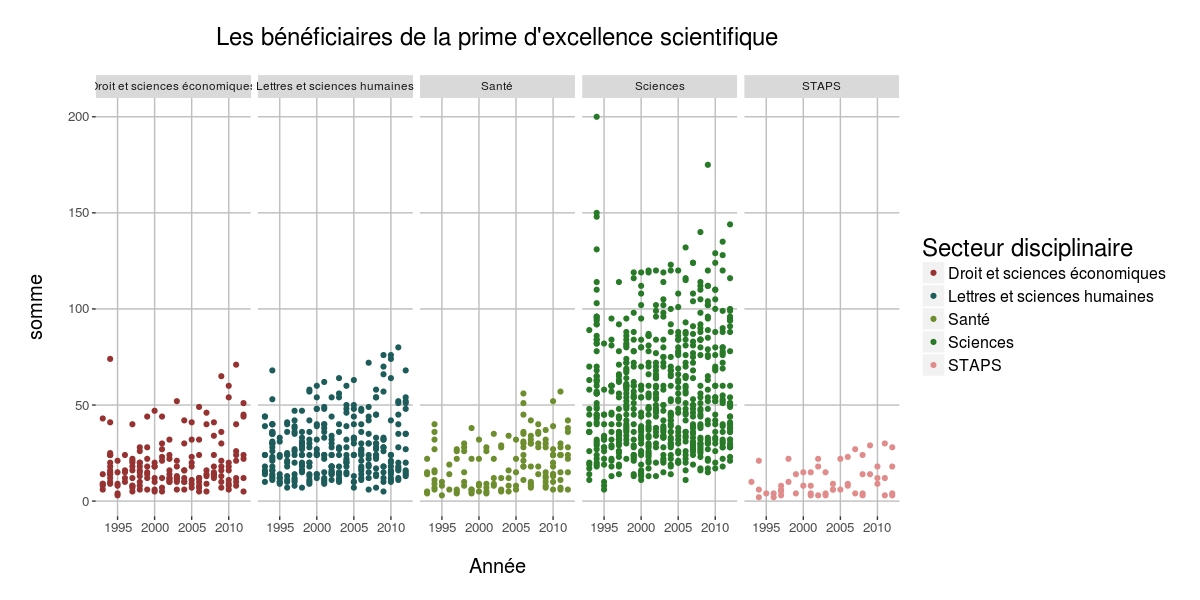
Value by sector
prim %>%
  group_by(Année, Bénéficiaires, `Secteur disciplinaire`) %>%
  summarise(somme = sum(Bénéficiaires))%>%
  ggplot(aes(Année,somme, group = `Secteur disciplinaire`, col = `Secteur disciplinaire`)) +
  geom_point() +
  scale_color_manual(values = databzh$colours) +
  facet_grid(~`Secteur disciplinaire`) +
  labs(title = "Les bénéficiaires de la prime d'excellence scientifique") +
  databzhTheme()
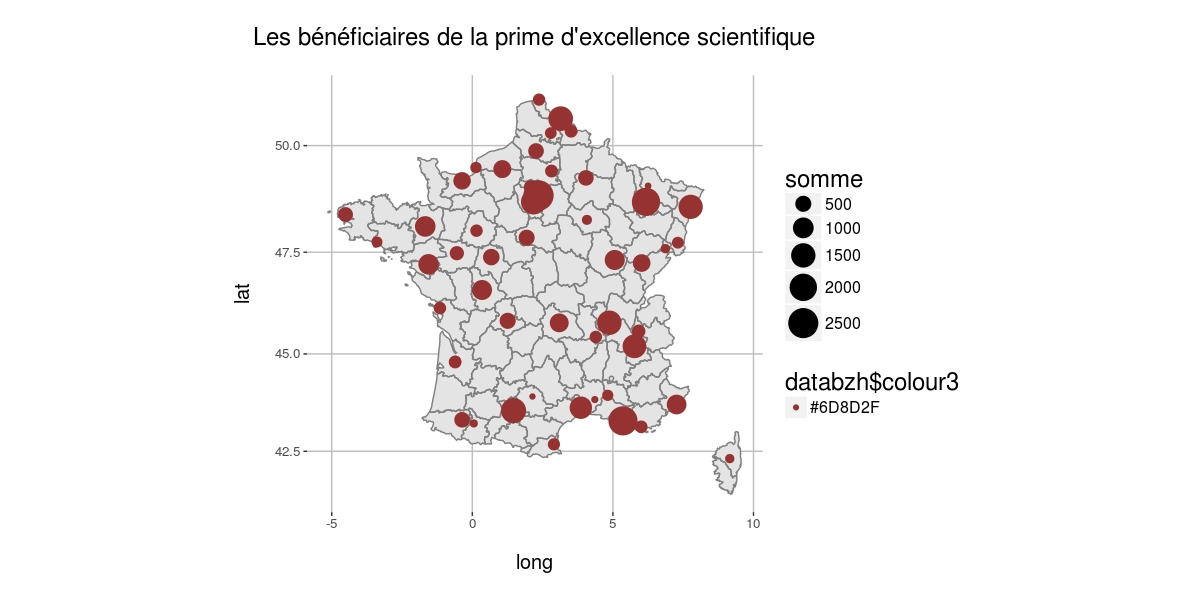
Map
#states <- map_data("france")
prim2 <- prim %>%
  separate(`Géo-localisation`, into = c("lon","lat"), sep =',') %>%
  group_by(lon, lat) %>%
  summarise(somme = sum(Bénéficiaires))
ggplot(states, aes(long,lat, group=group)) +
  geom_polygon(fill = "#e4e4e4") +
  coord_map() +
  geom_path(data=states, aes(long, lat, group=group, fill=NULL), color="grey50") +
  geom_point(data = prim2, aes(x = as.numeric(lat), y = as.numeric(lon), group = NULL,size = somme, col = databzh$colour3)) +
  scale_color_manual(values = palette) +
  scale_size(range = c(1,10)) +
  xlim(range(range(states$long))) +
  ylim(range(range(states$lat))) +
  labs(title = "Les bénéficiaires de la prime d'excellence scientifique") +
  databzhTheme()
Boxplot
ggplot(prim, aes(Région, Bénéficiaires)) +
  geom_boxplot(col = databzh$colour4) +
  coord_flip() +
  labs(title = "Les bénéficiaires de la prime d'excellence scientifique") +
  databzhTheme()

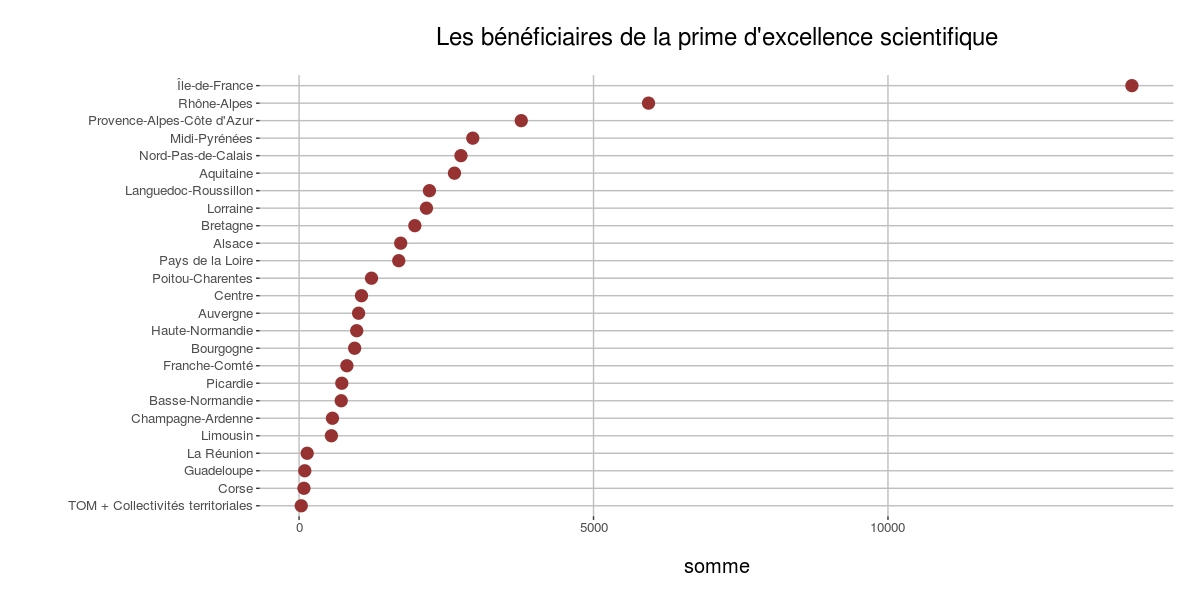
Dotplot
prim %>%
  group_by(Région) %>%
  summarise(somme = sum(Bénéficiaires))%>%
  ggplot(aes(reorder(Région, somme), somme)) +
  geom_point(col = databzh$colour1, size=4) +
  coord_flip() +
  xlab("")+
  labs(title = "Les bénéficiaires de la prime d'excellence scientifique") +
  databzhTheme()
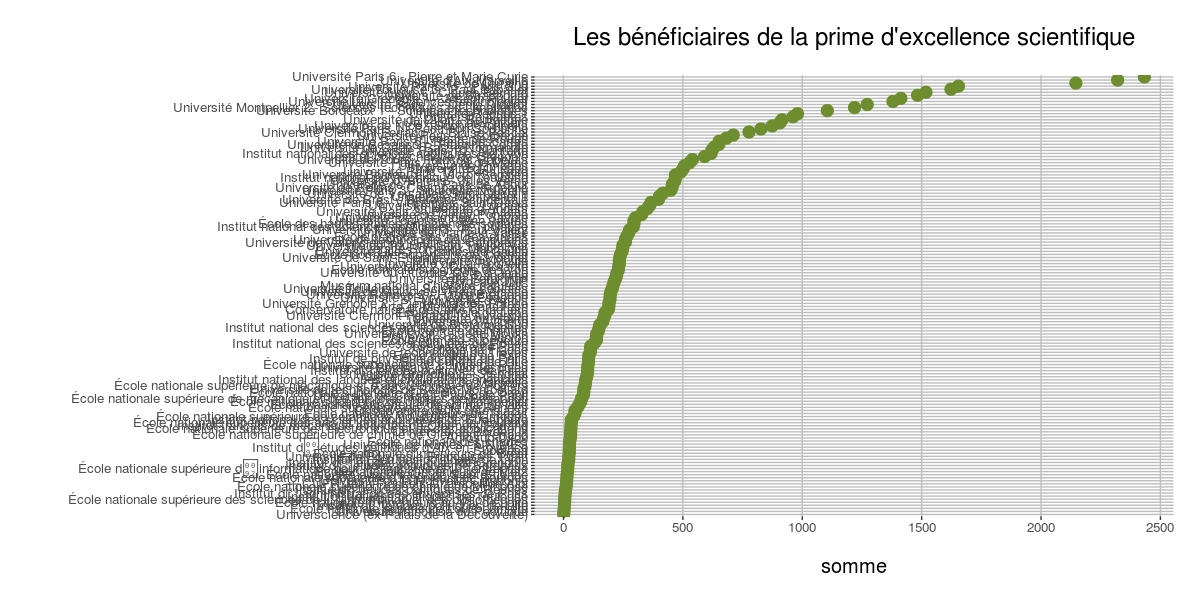
Dotplot bis
prim %>%
  group_by(Établissement) %>%
  summarise(somme = sum(Bénéficiaires))%>%
  na.omit() %>%
  ggplot(aes(reorder(Établissement, somme), somme)) +
  geom_point(col = databzh$colour3, size=4) +
  coord_flip() +
  xlab("")+
  labs(title = "Les bénéficiaires de la prime d'excellence scientifique") +
  databzhTheme()
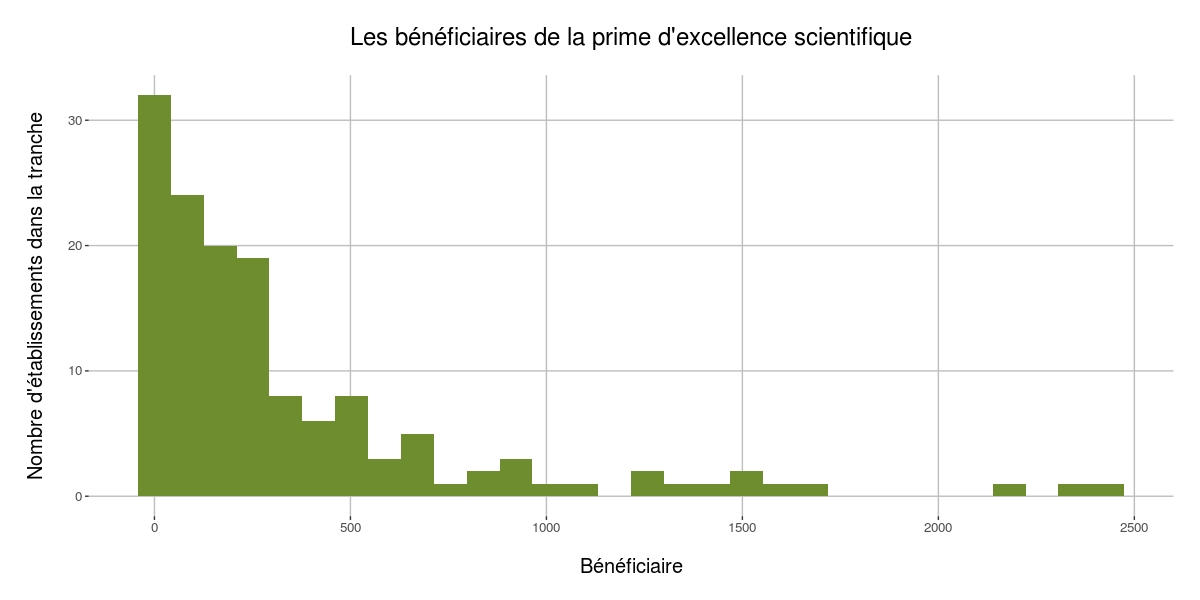
Histogram
prim %>%
  group_by(Établissement) %>%
  summarise(somme = sum(Bénéficiaires))%>%
  na.omit() %>%
  ggplot(aes(somme)) +
  geom_histogram(fill = databzh$colour3) +
  xlab("Bénéficiaire")+
  ylab("Nombre d'établissements dans la tranche") +
  labs(title = "Les bénéficiaires de la prime d'excellence scientifique") +
  databzhTheme()
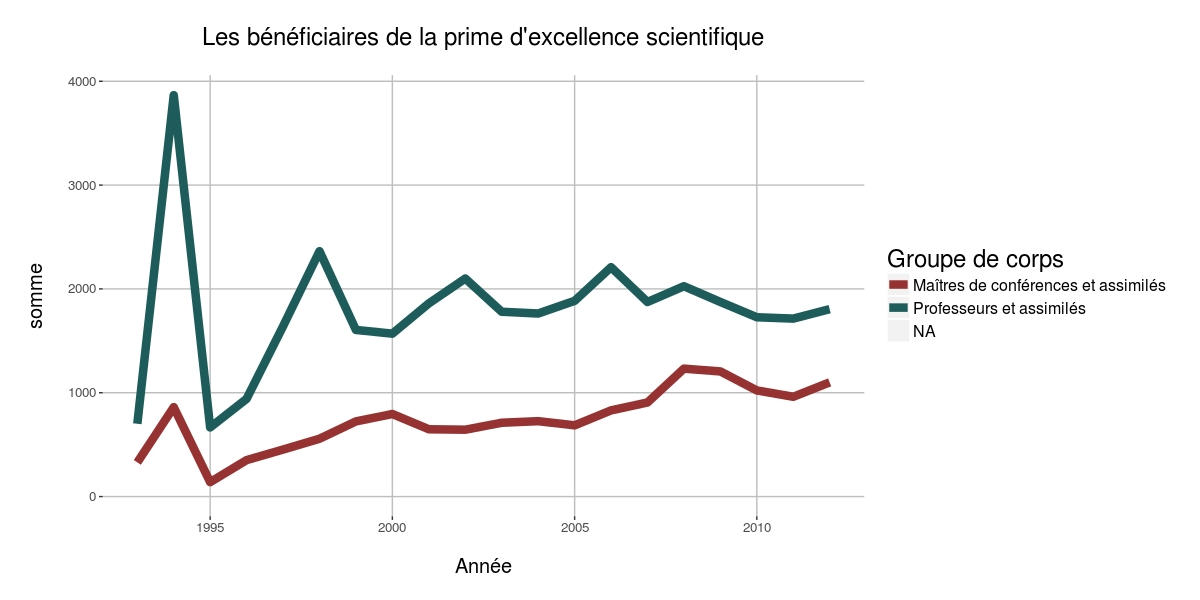
Line plot
prim %>%
  group_by(Année, `Groupe de corps`) %>%
  summarise(somme = sum(Bénéficiaires))%>%
  ggplot(aes(Année, somme, group =`Groupe de corps`, col =`Groupe de corps`)) +
  geom_line(stat = "identity", size = 3) +
  scale_color_manual(values = databzh$colours) +
  labs(title = "Les bénéficiaires de la prime d'excellence scientifique") +
  databzhTheme()
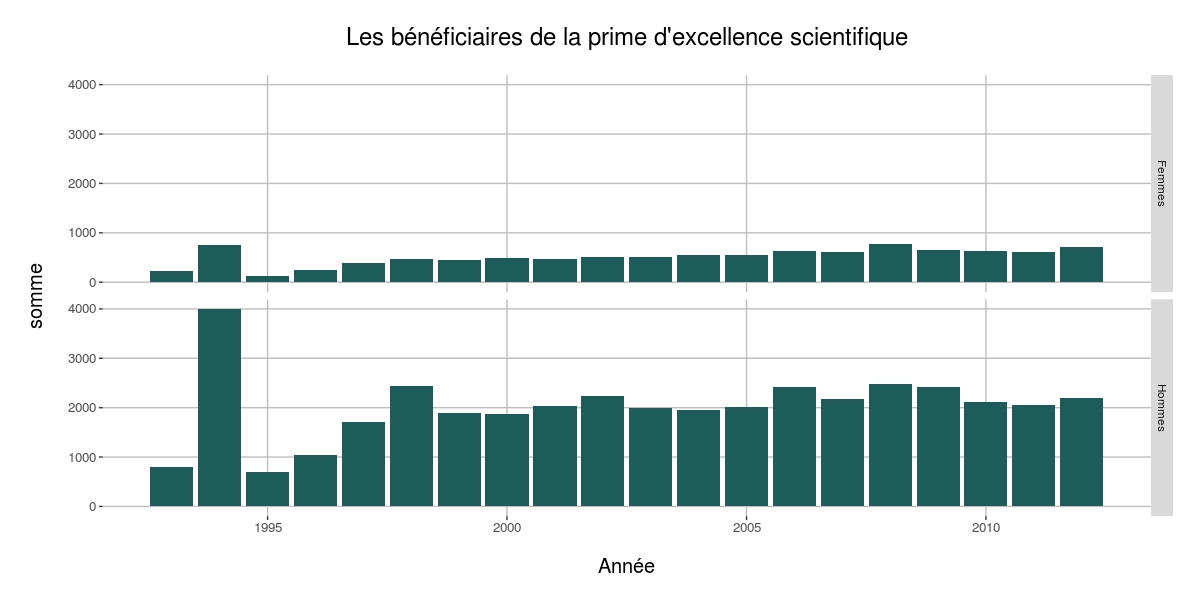
Barplot
prim %>%
  group_by(Année, Bénéficiaires, Sexe) %>%
  summarise(somme = sum(Bénéficiaires))%>%
  ggplot(aes(Année, somme)) +
  geom_bar(stat = "identity", fill = databzh$colour2) +
  scale_fill_manual(values = databzh$colours) +
  facet_grid(Sexe~.) +
  labs(title = "Les bénéficiaires de la prime d'excellence scientifique") +
  databzhTheme()
What do you think?