
Rstats Create A Pixel Map With R
The whole webdesign of Data Bzh has recently been updated. With it, a new header containing a pixelized map of Brittany. Here’s how you can replicate it in R, with a map of France, US and the world.
Load map
First, you’ll need to load the ggplot2 package, and one of the default maps — the package includes county, france, italy, nz, state, usa, world, and world2. For more info, see ?map_data.
library(ggplot2)
map <- map_data("france")
You now have a dataframe ready to be plotted. In your ggplot call, set the data argument to map, the x and y of your aesthetic to long and lat, and the group arg to group.
For this kind of map, you need to use the geom_polygon function, which works pretty much like geom_path, except the polygons are connnected with the group arg, and can be filled.
The coord_map _function sets the coordinate system for projecting a map, and allows to keep the proportions fixed, no matter how you change the size of your viewport. Note that you can also use _coord_fixed to always keep the x/y ratio to 1.
Finally, theme_void allows you to get rid of everything except the geom.
ggplot(map, aes(long,lat, group=group)) +
geom_polygon() +
coord_map() +
theme_void()
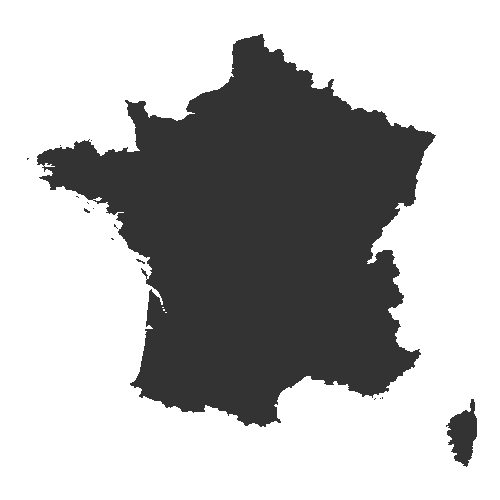
Ok, not really sexy, I’ll admit that :)
But here’s is the tip for creating a pixel effect : round the long and lat, in order to make the border more squared (now, we’ll also fill according to groups).
ggplot(map, aes(round(long, 1),round(lat,1), group=group,fill = as.factor(group))) +
geom_polygon() +
guides(fill=FALSE) +
coord_map() +
theme_void()
![]()
Let’s try a more hardcore pixelization :
ggplot(map, aes(round(long, 0),round(lat,0), group=group,fill = as.factor(group))) +
geom_polygon() +
guides(fill=FALSE) +
coord_map() +
theme_void()
![]()
Ok, that’s not very informative, but this map looks cool, right!
For an even more sexy look, you can put the borders back with a geom_path:
ggplot(map, aes(round(long, 0),round(lat,0), group=group,fill = as.factor(group))) +
geom_polygon() +
geom_path(data = map, aes(long, lat, group=group)) +
guides(fill=FALSE) +
coord_map() +
theme_void()
![]()
Tada!
US & world map
Here is the code you can use to make a pixel world map.
ggplot(map_data("world"), aes(round(long, 0),round(lat, 0), group=group, fill = as.factor(group))) +
geom_polygon() +
guides(fill=FALSE) +
coord_fixed() +
theme_void()
![]()
And a US map:
ggplot(map_data("state"), aes(round(long, 0),round(lat, 0), group=group, fill = as.factor(group))) +
geom_polygon() +
guides(fill=FALSE) +
coord_map() +
theme_void()
![]()
And, of course, you can create your own pixel maps with other shapefiles ;)
The larger the portion of the earth you want to map, the more “imprecise” you need to make your lat and long variables — here, we’re just cutting off the decimal part of these number, but you can imagine rounding to the closest decile. Anyone to give it a try?
What do you think?