
Predict french vote with R
Let’s try a prediction of the french presidential vote, based on the results from the first round.
Before the second poll of the french election (May 7th), candidates are invited to give voting instructions to their supporters, supporting one of the candidates still in the running. Let’s try to predict the results of the second round, based on these information.
Disclaimer: the predictions contained in this work are purely hypothetical, and rely on very strong and unrealistic assumptions, like “voters for a candidate will follow his voting instructions”.
Creating the data
I’ve extracted the info from :
Let’s create the tibble.
library(tidyverse)
result <- tibble(
  NOM = c("MACRON","MÉLENCHON","FILLON","LEPEN","HAMON","DUPONT-AIGNAN","POUTOU","LASSALLE","ARTHAUD","ASSELINEAU", "CHEMINADE","BLANC"),
  SIDE = c("CENTRE", "GAUCHE", "DROITE","DROITE","GAUCHE","DROITE", "GAUCHE", "SANS ETIQUETTE","GAUCHE","DROITE","GAUCHE", "BLANC"),
  APPEL = c("MACRON","NSP","MACRON","LEPEN","MACRON","NSP","NSP",
            "NSP","BLANC","NSP","NSP","BLANC"),
  VOIX = c(8654331, 7058859, 7211121,7678558, 2291025, 1694898, 394510,
           435367, 232439, 332592, 65671, 655404),
  POURC = round(VOIX / 36704775 * 100, 2)
)
Notes: in the APPEL column, the “NSP” factor means that the candidate didn’t give instructions to his/her supporters.
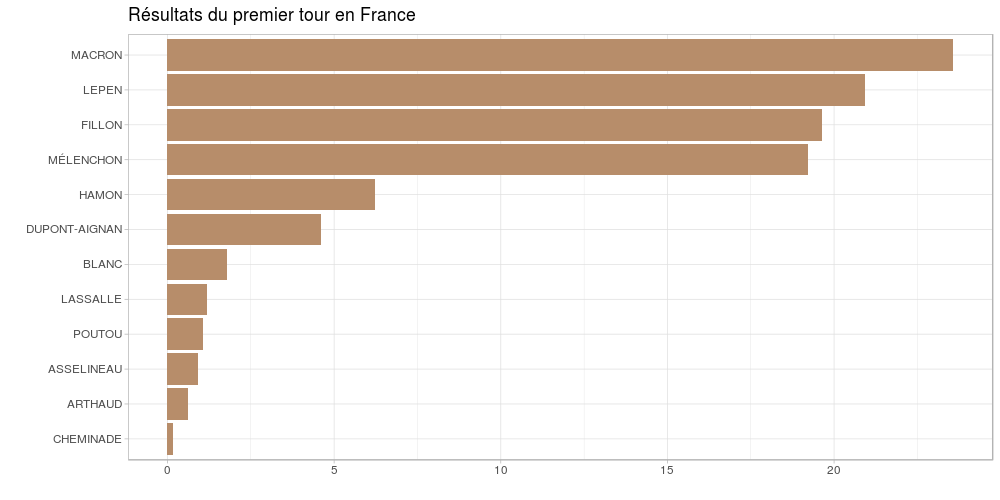
Let’s start by a short visualisation of the results :
ggplot(result, aes(reorder(NOM, POURC), POURC)) +
  geom_bar(stat = "identity", , fill = "#b78d6a") +
  coord_flip() +
  labs(title = "Résultats du premier tour en France",
       x = "",
       y = "")+
  theme_light()
Simulating second round results
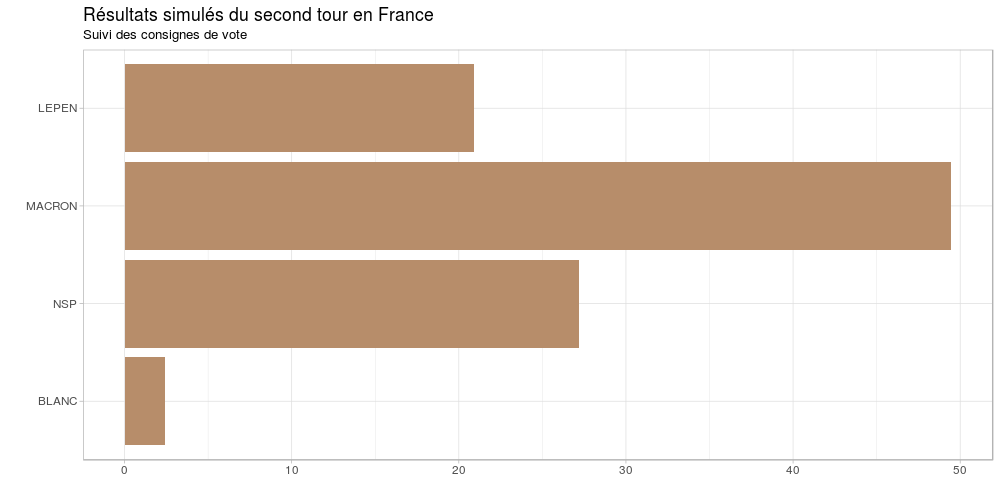
Here are the results if everyone who voted for a candidate on the first round follows the instructions give by this candidate.
ggplot(result, aes(reorder(APPEL, POURC), POURC)) +
  geom_bar(stat = "identity", , fill = "#b78d6a") +
  coord_flip() +
  labs(title = "Résultats simulés du second tour en France",
       subtitle = "Suivi des consignes de vote",
       x = "",
       y = "")+
  theme_light()
 Ok, now what do we do with the candidate who hasn’t give any instruction?
Let’s try various scenarios.
What would happen if the NSP equally vote for each candidate?
library(stringr)
sim1 <- result %>%
  group_by(APPEL) %>%
  summarise(VOIX = sum(POURC))
sim1$VOIX <- c(sim1$VOIX[[1]],
               sim1$VOIX[[2]] + sim1$VOIX[[4]]/2,
               sim1$VOIX[[3]]+ sim1$VOIX[[4]]/2,
               NA)
sim1 <- na.omit(sim1)
ggplot(sim1, aes(reorder(APPEL, VOIX), VOIX)) +
  geom_bar(stat = "identity", , fill = "#b78d6a") +
  coord_flip() +
  labs(title = "Résultats simulés du second tour en France",
       subtitle = "NSP à 50 / 50 Macron - Le Pen",
       x = "",
       y = "")+
  theme_light()
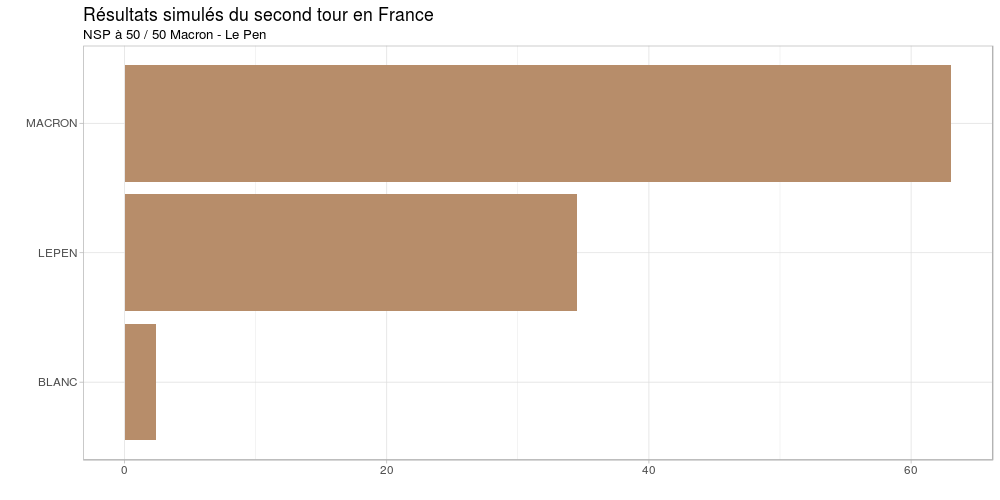
Ok, we’re good with that one. What would happen if all the NSP vote for Marine Le Pen?
result %>%
  mutate(APPEL = str_replace_all(result$APPEL, "NSP", "LEPEN")) %>%
  ggplot(aes(reorder(APPEL, POURC), POURC)) +
  geom_bar(stat = "identity", , fill = "#b78d6a") +
  coord_flip() +
  labs(title = "Résultats simulés du second tour en France",
       subtitle = "NSP 100% Marine Le Pen",
       x = "",
       y = "")+
  theme_light()
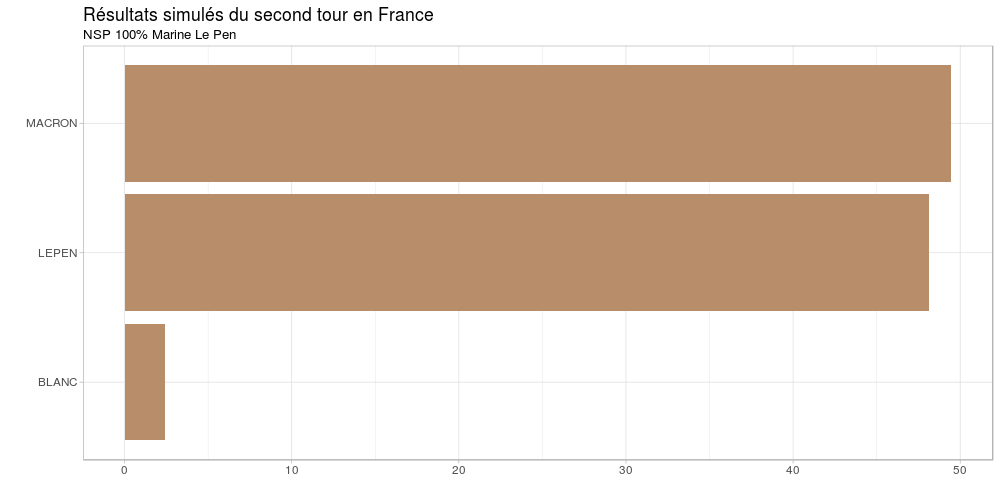
Aaaand that’s tight, but Macron still wins. What if all NSP go to Macron?
result %>%
  mutate(APPEL = str_replace_all(result$APPEL, "NSP", "MACRON")) %>%
  ggplot(aes(reorder(APPEL, POURC), POURC)) +
  geom_bar(stat = "identity", , fill = "#b78d6a") +
  coord_flip() +
  labs(title = "Résultats simulés du second tour en France",
       subtitle = "NSP 100% Macron",
       x = "",
       y = "")+
  theme_light()
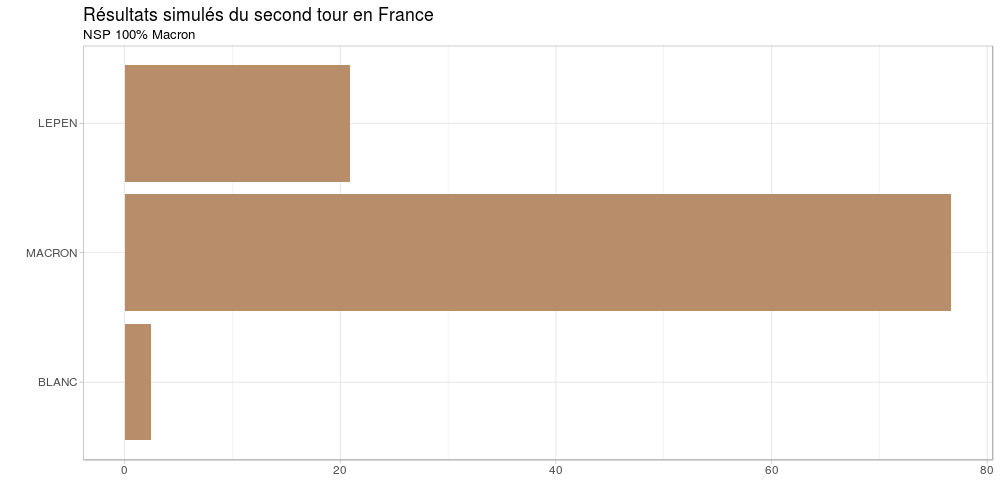
Yeah, that was obvious.
Left vs Right wing
OK, let’s try something else. What if all voters who chose a right wing candidate vote for Marine Le Pen, and voters for a left wing candidate Emmanuel Macron ?
result %>%
  left_join(data.frame(SIDE = c("CENTRE","GAUCHE","DROITE", "BLANC", "SANS ETIQUETTE"),
                       SIM = c("MACRON","MACRON","LEPEN", "BLANC", "BLANC")), by = "SIDE") %>%
  ggplot(aes(reorder(SIM.y, POURC), POURC)) +
  geom_bar(stat = "identity", , fill = "#b78d6a") +
  coord_flip() +
  labs(title = "Résultats simulés du second tour en France",
       x = "",
       y = "")+
  theme_light()
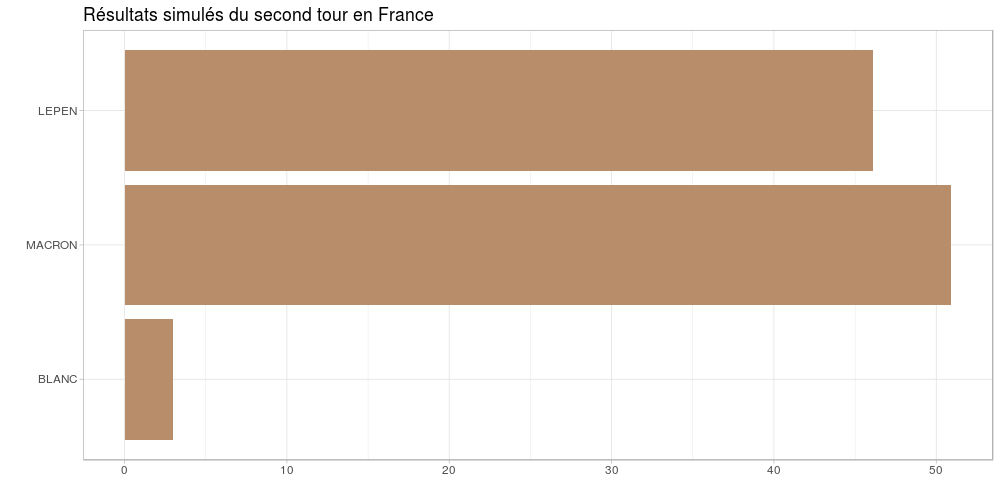
Ok, still tight, but Emmanuel Macron still wins
What do you think?