
Mapping the French second round results with R
Visualising the second round results with maps made with R.
The dataset
The dataset used here is available on data.gouv: Election présidentielle des 23 avril et 7 mai 2017 - Résultats du 2ème tour. In order to make it easier to import, I’ve manually converted the xls file to csv.
Load libraries and data
Let’s load this dataset, as well as the map of France available in ggplot2.
library(tidyverse)
library(stringr)
library(stringi)
result <- read_csv2("Presidentielle_2017_Resultats_Communes_Tour_2.csv")
map <- map_data("france")
Clean data
Before mapping the results, we need to transform and clean the data.frame.
result <- result %>%
  group_by(`Libellé du département`) %>%
  summarise(tot_vot = sum(Exprimés),
            tot_blanc = sum(Blancs),
            pourcentage_blanc = tot_blanc / sum(Votants) * 100,
            tot_abs = sum(Abstentions),
            pourcentage_abs = tot_abs / sum(Inscrits)* 100,
            tot_macron = sum(Voix),
            tot_lepen = sum(Voix_1),
            pourcentage_macron = tot_macron / tot_vot * 100,
            pourcentage_lepen = tot_lepen / tot_vot * 100)
names(result)[1] <- "region"
result$region <- stri_trans_general(result$region, "Latin-ASCII") %>%
  str_replace_all("Cote-d'Or", "Cote-Dor") %>%
  str_replace_all("Cotes-d'Armor", "Cotes-Darmor") %>%
  str_replace_all("Corse-du-Sud", "Corse du Sud") %>%
  str_replace_all("Val-d'Oise", "Val-Doise") %>%
  str_replace_all("Corse-du-Sud", "Corse du Sud")
We now got a table containing the key figures by department. The name of the first column has been modified, in order to match the region name of the map table. The character replacement sequence is due to the English notation in map, and was required in order to join the tables properly.
result_map <- left_join(x = map[,-6], y = result)
Visualisation
Let’s now project our variables on maps. You need to play with the scale_fill argument to manage the color scheme used on each card.
Note : this article was first published in french. I’ve kept the original plot titles.
map_theme <- theme(title=element_text(),
plot.title=element_text(margin=margin(20,20,20,20), size=18, hjust = 0.5),
axis.text.x=element_blank(),
axis.text.y=element_blank(),
axis.ticks=element_blank(),
axis.title.x=element_blank(),
axis.title.y=element_blank(),
panel.grid.major= element_blank(),
panel.background= element_blank())
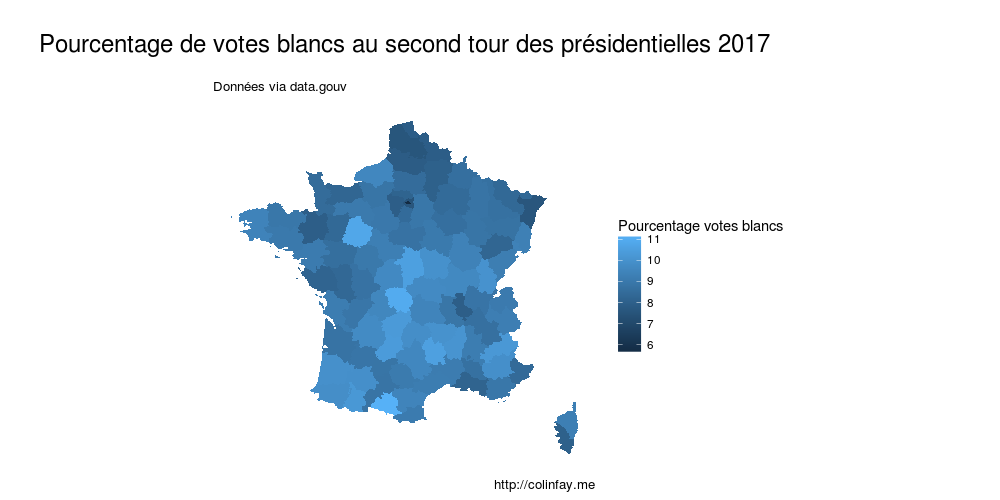
ggplot(result_map, aes(long,lat, group = group, fill = pourcentage_blanc)) +
geom_polygon() +
coord_map() +
scale_fill_gradient(name = "Pourcentage votes blancs") +
labs(x = "",
y = "",
title = "Pourcentage de votes blancs au second tour des présidentielles 2017",
subtitle = "Données via data.gouv",
caption = "http://colinfay.me") +
map_theme
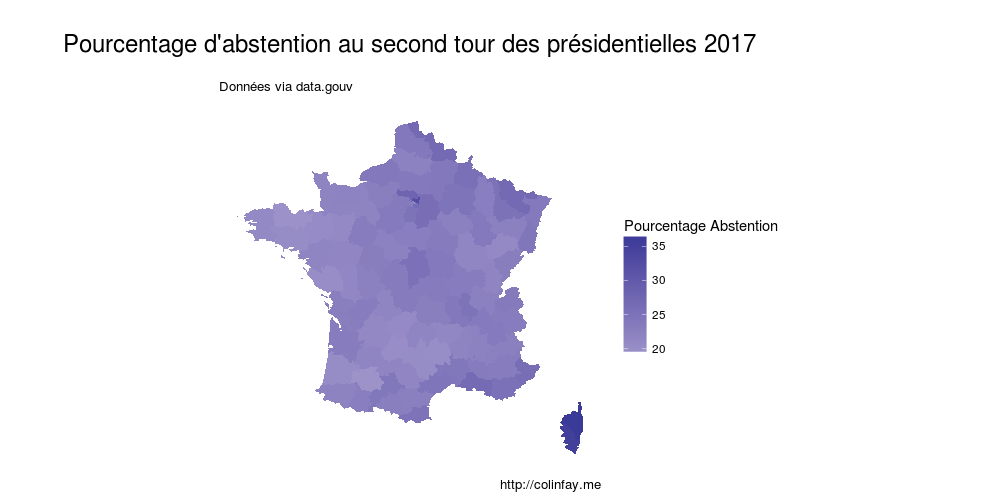
ggplot(result_map, aes(long,lat, group = group, fill = pourcentage_abs)) +
  geom_polygon() +
  coord_map() +
  scale_fill_gradient2(name = "Pourcentage Abstention") +
  labs(x = "",
       y = "",
       title = "Pourcentage d'abstention au second tour des présidentielles 2017",
       subtitle = "Données via data.gouv",
       caption = "http://colinfay.me") +
  map_theme
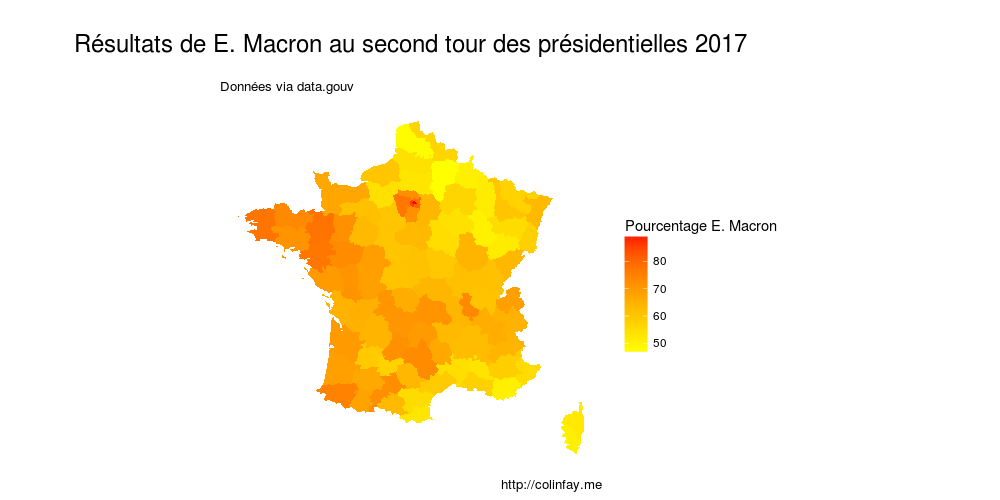
ggplot(result_map, aes(long,lat, group = group, fill = pourcentage_macron)) +
  geom_polygon() +
  coord_map() +
  scale_fill_gradientn(colours = c("yellow","red"), name = "Pourcentage E. Macron") +
  labs(x = "",
       y = "",
       title = "Résultats de E. Macron au second tour des présidentielles 2017",
       subtitle = "Données via data.gouv",
       caption = "http://colinfay.me") +
  map_theme
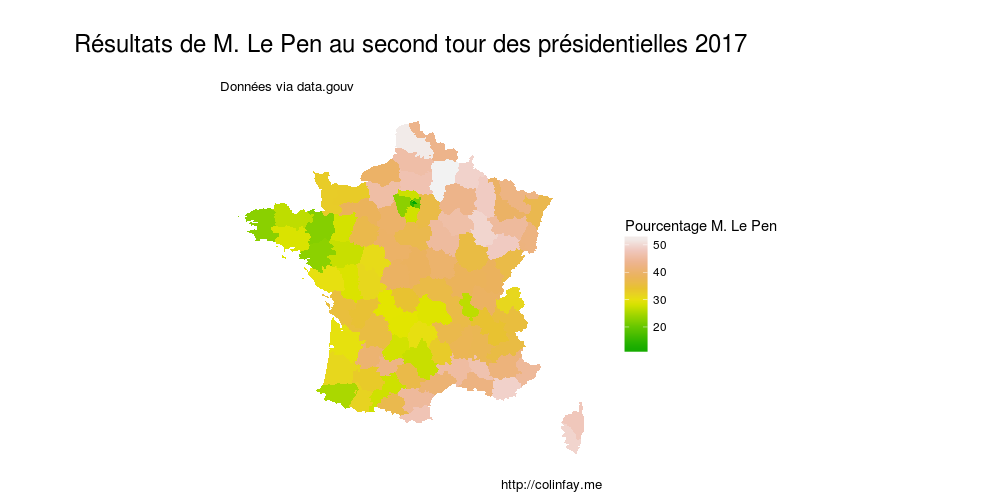
ggplot(result_map, aes(long,lat, group = group, fill = pourcentage_lepen)) +
  geom_polygon() +
  coord_map() +
  scale_fill_gradientn(colours = terrain.colors(10), name = "Pourcentage M. Le Pen") +
  labs(x = "",
       y = "",
       title = "Résultats de M. Le Pen au second tour des présidentielles 2017",
       subtitle = "Données via data.gouv",
       caption = "http://colinfay.me") +
  map_theme
What do you think?