Create a map with R — rgeoapi, ggmap and ggplot2
Improve your mapping with rgeoapi, a package designed to access the french geographic database.
rgeowhat ?
Developped by Etalab, with La Poste, l’INSEE and OpenStreetMap, the GeoAPI API is a JSON interface designed to make requests on the French geographic database.
rgeoapi was developped to facilitate your geographic projects by giving you access to these informations straight inside R. With rgeoapi, you can get any coordinate, size and population of a French city, to be used in your maps.
To install :
rinstall.packages("rgeoapi")
Get coordinates
So, let’s imagine you have a dataset with only the names of the cities you want to map. Like:
villes <- data.frame(nom = c("Rennes", "Lorient", "Brest", "Vannes"), variable1 = c("a", "b", "c", "b"), variable2 = c("Un", "Deux", "Un", "Deux"))
| nom | variable1 | variable2 |
|---|---|---|
| Rennes | a | Un |
| Lorient | b | Deux |
| Brest | c | Un |
| Vannes | b | Deux |
To put these cities on a map, you’ll need their coordinates. For that, you can use rgeoapi!
library(rgeoapi)
library(plyr)
geo <- ldply(villes$nom, ComByName)
| name | codeInsee | codeDepartement | codeRegion | population |
|---|---|---|---|---|
| Rennes | 35238 | 35 | 53 | 211373 |
| Rennes-le-Château | 11309 | 11 | 76 | 58 |
| Rennes-les-Bains | 11310 | 11 | 76 | 258 |
| Rennes-sur-Loue | 25488 | 25 | 27 | 88 |
| Rennes-en-Grenouilles | 53189 | 53 | 52 | 117 |
| Lorient | 56121 | 56 | 53 | 57961 |
| Brest | 29019 | 29 | 53 | 139386 |
| Brestot | 27110 | 27 | 28 | 518 |
| Esboz-Brest | 70216 | 70 | 27 | 485 |
| Vannes | 56260 | 56 | 53 | 53032 |
| Vannes-le-Châtel | 54548 | 54 | 44 | 579 |
| Pouy-sur-Vannes | 10301 | 10 | 44 | 145 |
| Saulxures-lès-Vannes | 54496 | 54 | 44 | 363 |
| Vannes-sur-Cosson | 45331 | 45 | 24 | 589 |
| surface | lat | long | X_score |
|---|---|---|---|
| 5035 | 48.11 | -1.679 | 1 |
| 1497 | 42.91 | 2.277 | 0.7636 |
| 1975 | 42.92 | 2.341 | 0.7533 |
| 547 | 47.01 | 5.855 | 0.6743 |
| 801 | 48.49 | -0.5083 | 0.6239 |
| 1533 | 47.75 | -3.378 | 1 |
| 4948 | 48.4 | -4.502 | 0.7183 |
| 884 | 49.34 | 0.6783 | 0.6958 |
| 977 | 47.8 | 6.441 | 0.4919 |
| 3313 | 47.65 | -2.749 | 1 |
| 1747 | 48.57 | 5.785 | 0.7384 |
| 1579 | 48.3 | 3.597 | 0.6873 |
| 1826 | 48.52 | 5.804 | 0.678 |
| 3558 | 47.72 | 2.202 | 0.6653 |
names(villes)[1] <- "name"
villes <- merge(villes, geo, by = "name", all.x = TRUE)
Create a map with ggmap and ggplot2
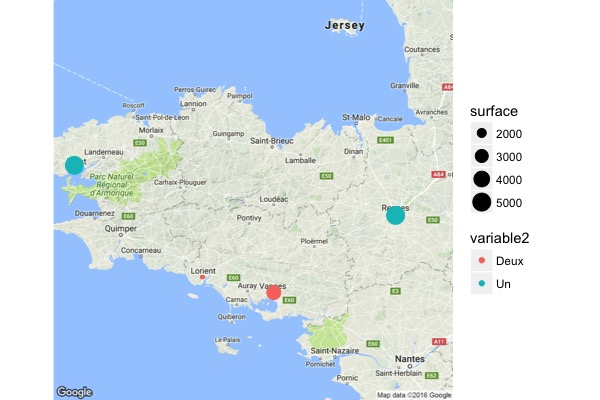
The ggmap package has been designed to produce background maps to be used with ggplot2. The “fast” function to create a map is qmap(x,y) - the first argument referring to the query (city / department / region …) and the second to the zoom level of Google map.
library(ggmap)
map <- qmap('Bretagne', zoom = 8)
Once you have a map object, you can use it as the first argument of your ggplot call, and then combine it with your usual geom:
map + geom_point(data = villes, aes(x = long, y = lat, color= variable2, size = surface))
Easy, isn’t it!

What do you think?