
All I want for Christmas is a #Dataviz
Just before Christmas, let’s enjoy these two visualisations created with data from the lastfm API.
Allô LastFM
First, you need to create an account on lastfm, and get an access key. When you have it, you can start making resquests on the API with R.
Let’s load the packages we will need:
library(tidyverse)
library(scales)
library(data.table)
library(magrittr)
Here are the three parameters you will need before starting:
#The query
query <- "christmas"
#Your API key (masked here)
apikey <- "XXX"
#The page index
x <- 0
Then, the search url. Each request is limited to 1000 answers. The results are divided in pages, and you can access them with the arg &page=".
url <- paste0("http://ws.audioscrobbler.com/2.0/?method=track.search&track=",
query,"&api_key=", apikey, "&format=json","&page=", x)
Let’s create a list to concatenate our results, and query the first page (index = 0).
dl <- list()
dl2 <- httr::GET(url)$content %>%
  rawToChar() %>%
  rjson::fromJSON()
dl2 <- dl2$results$trackmatches$track
dl <- c(dl,dl2)
Then, we loop over all the pages:
repeat{
x <- x+1
url <- paste0("http://ws.audioscrobbler.com/2.0/?method=track.search&track=",
query,"&api_key=", apikey, "&format=json","&limit=", 1000, "&page=", x)
dl2 <- httr::GET(url)$content %>%
rawToChar() %>%
rjson::fromJSON()
dl2 <- dl2$results$trackmatches$track
dl <- c(dl, dl2)
if(length(dl2) == 0){
break
}
}
And now, let’s create the dataframe:
songs <- lapply(dl, function(x){
  data.frame(name = x$name,
             artist = x$artist,
             listeners = as.numeric(x$listeners))
}) %>%
  do.call(rbind, .) %>%
  arrange(listeners)
And now, let’s see!
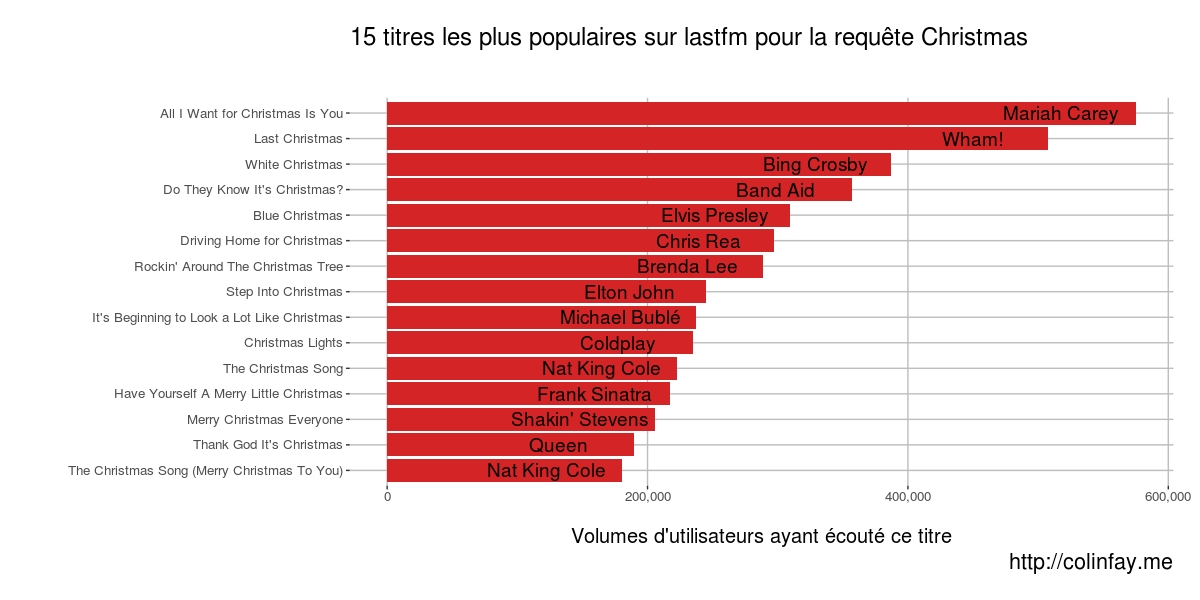
The fifteen most popular songs are:
songs <- as.data.table(songs)
songs <- songs[, .(listeners = mean(listeners)), by = .(name,artist)]
songs[1:15,] %>%
ggplot(aes(x = reorder(name, listeners), y = listeners)) +
  geom_bar(stat = "identity", fill = "#d42426") +
  geom_text(data = songs[1:15,], aes(label= artist), size = 5, nudge_y = -sd(songs$listeners[1:15])/2) +
  coord_flip() +
  xlab("") +
  ylab("Volumes d'utilisateurs ayant écouté ce titre") +
  scale_y_continuous(labels = comma) +
  labs(title = "15 titres les plus populaires sur lastfm pour la requête Christmas",
       subtitle = " ",
       caption = "http://colinfay.me") +
  theme(axis.text=element_text(size=10),
        axis.title=element_text(size=15),
        title=element_text(size=18),
        plot.title=element_text(margin=margin(0,0,20,0), size=18),
        axis.title.x=element_text(margin=margin(20,0,0,0)),
        axis.title.y=element_text(margin=margin(0,20,0,0)),
        legend.text=element_text(size = 12),
        plot.margin=margin(20,20,20,20),
        panel.background = element_rect(fill = "white"),
        panel.grid.major = element_line(colour = "grey"))
 (click to zoom)
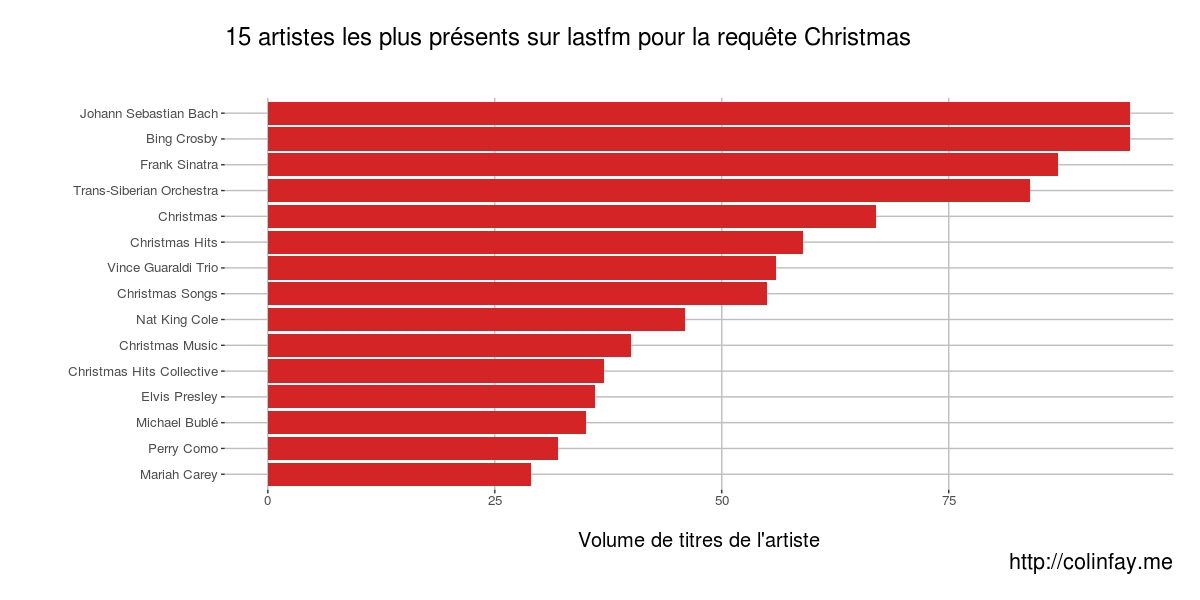
And the most frequent artists:
songs$artist %>%
  table() %>%
  as.data.frame() %>%
  arrange(desc(Freq)) %>%
  head(15) %>%
ggplot(aes(x = reorder(., Freq), y = Freq)) +
  geom_bar(stat = "identity", fill = "#d42426") +
  coord_flip() +
  xlab("") +
  ylab("Volume de titres de l'artiste") +
  scale_y_continuous(labels = comma) +
  labs(title = "15 artistes les plus présents sur lastfm pour la requête Christmas",
       subtitle = " ",
       caption = "http://colinfay.me") +
  theme(axis.text=element_text(size=10),
        axis.title=element_text(size=15),
        title=element_text(size=18),
        plot.title=element_text(margin=margin(0,0,20,0), size=18),
        axis.title.x=element_text(margin=margin(20,0,0,0)),
        axis.title.y=element_text(margin=margin(0,20,0,0)),
        legend.text=element_text(size = 12),
        plot.margin=margin(20,20,20,20),
        panel.background = element_rect(fill = "white"),
        panel.grid.major = element_line(colour = "grey"))
 (click to zoom)
So now… Merry Christmas!

What do you think?